
While I have known about Forge for quite some time now; if I remember correctly it was introduced around 2020. I only started using it more seriously around January 2026. I wrote about that experience in another article.
When you first step into the Forge ecosystem, you quickly realize something important: building the app is the easy part. Understanding the platform constraints and operational metrics is what really determines whether your app will perform reliably in production.
And if you’re building apps intended for the Atlassian Marketplace, this becomes even more important.
Let’s talk about one of the most misunderstood parts of Forge: invocations and metrics.
Understanding the Constraints of Forge
Forge is essentially a serverless hosting platform managed by Atlassian. Your backend logic runs as functions inside a managed runtime environment.
Because of that, your app operates within certain limits such as:
Hosting infrastructure limits
API rate limits
Function memory limits
Persistent storage limits
Key-value storage limits
SQL limits
Payload sizes
Performance and execution duration
These constraints exist to ensure fair usage and platform stability across all apps.
Understanding them early will save you from serious headaches later.
Forge Runtime and Infrastructure
Every Forge function runs inside a managed runtime powered by Node.js.
Each invocation receives:
512 MB of memory by default
configurable memory up to 1 GB per invocation depending on configuration
Forge executes these functions inside secure cloud infrastructure managed by Atlassian. From a developer perspective, you don’t manage servers, containers, or scaling. Forge handles all of that automatically. That convenience, however, comes with limits you must design around.
What is a Forge Invocation?
An invocation happens whenever Forge executes one of your app functions.
Examples include:
UI actions calling a resolver
Web triggers
scheduled triggers
event listeners
background queue consumers
functions invoked via "@Forge/bridge"
Each of these executions counts as a function invocation.
Forge records these invocations to monitor:
success rates
errors
execution time
resource consumption
These metrics are visible in the Developer Console.
The importance of Invocations
Forge operates on a consumption-based model. Atlassian provides a free tier, but usage beyond that can incur additional costs.
Because of this, every invocation matters.
Things that increase invocation usage include:
background queue processing
retries
scheduled jobs
repeated API calls
inefficient loops
If your app is poorly optimized, invocation counts can spike very quickly.
The Forge Metrics Dashboard
Inside the Forge Developer Console, Atlassian provides a metrics dashboard where vendors can monitor app performance.

You can view:
Invocation count
Invocation success rate
Invocation errors
Invocation response time
API metrics
usage metrics (compute, storage, logs)
These metrics help you understand how your app behaves across all installations.
Invocation metrics specifically show:
successful vs failed function executions
error types such as memory exhaustion or timeouts
execution duration of functions
For vendors building production apps, this dashboard is essential.
Understanding Invocation Errors
The console groups invocation failures into categories such as:
Out of memory
Timeouts
Unhandled exceptions
Deprecated runtime usage
If your function fails for any of these reasons, the failure appears in the metrics dashboard.
This allows you to quickly identify problematic functions across installations.
Understanding Latency Percentiles
Forge metrics also display latency percentiles, which show how fast your functions execute.
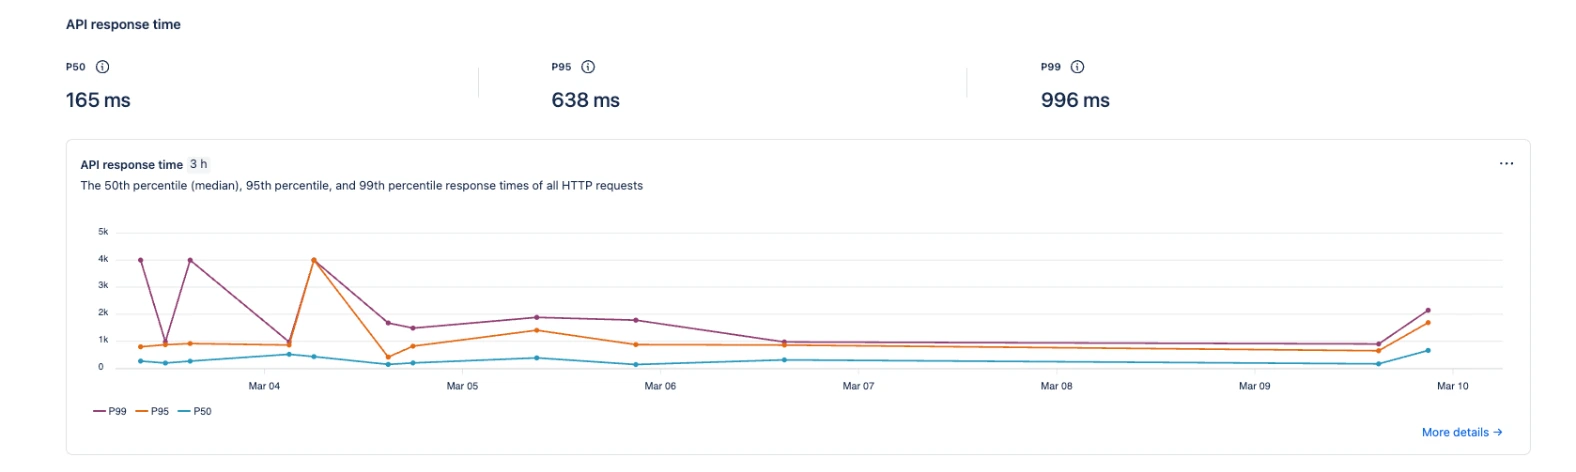
These are commonly shown as:
P50 - Median Response Time
P50 represents the median execution time.
This means:
50% of all function invocations complete faster than this 165ms.
This metric represents the typical performance of your app.
For Forge apps:
<150 ms is typically excellent.
P95 - Heavy Execution Range
P95 means:
95% of all invocations complete within a certain time.
Only 5% of requests take longer.
Higher P95 values usually indicate:
heavier database or storage reads
large data processing
complex API interactions
P99 - Worst Case Performance
P99 represents the slowest executions.
Only 1% of requests are slower than this value.
These often occur during:
cold starts
large payload processing
external API delays
retries or heavy computations
When Performance Becomes a Problem
As a general guideline for Forge apps:
Performance may need investigation when:
P50 > 500 ms
P95 > 2 seconds
P99 > 5 seconds
When these numbers increase consistently, it usually means the app has:
inefficient logic
excessive API calls
heavy processing inside a single function
How Retries Can Affect Invocation Costs
One of the easiest ways to accidentally inflate invocation usage is through retry logic.
For example, if you have a queue consumer processing jobs and something fails, Forge may retry that job automatically depending on your architecture.
Without safeguards, retries can run repeatedly.
If a job processes large data sets say a JQL query returning thousands of issues; each retry can trigger additional function invocations. Over time, this can significantly increase compute usage.
A simple defensive pattern is limiting retry attempts.
Example:
This prevents runaway retries and protects both performance and invocation costs.
Why Vendors Should Monitor Metrics Regularly
Metrics are not just diagnostic tools.
They are one of the best ways to improve your app architecture.
With the Forge metrics dashboard you can detect:
performance regressions
API bottlenecks
inefficient queries
cold start issues
scaling problems
You can also filter metrics by:
environment
site installation
time range
function handler
This makes it possible to track performance across multiple customers.
Conclusion
Forge removes a lot of operational complexity for developers. You don’t manage servers, scaling, or infrastructure.
But that does not mean infrastructure concerns disappear.
Understanding invocations, metrics, and platform limits is critical if you want your app to scale reliably.
The Forge metrics dashboard is one of the most powerful tools available to vendors. Used correctly, it allows you to identify issues early, optimize your functions, and deliver a much more reliable experience to your customers.
And if you’re building Marketplace apps, reliability is not optional, it’s expected.